

DOGE is on a selling frenzy as the prices slide to Daily support levels. The market prices are in turmoil as the bulls lost an important support zone of $0.0656. The falling prices are frustrating the investors as their portfolio has turned red.
- DOGE/USDT is down 0.78% as of today’s trading session
- DOGE/USDT managed to bounce from its daily support of $0.0573
DOGE/USDT is trading at $0.0619 as the prices plunge amidst the selling pressure of the bears. The market was trading in a range between $0.1050 and $0.0656 before it broke down 10 days back. This breakdown triggered panic selling where the prices plunged by almost 19%. The price almost broke the level of $0.0573, but wasn’t able to sustain below. The bulls quickly showed up while pushing the price by almost 15% at its current levels.
The Daily chart shows a downtrend.
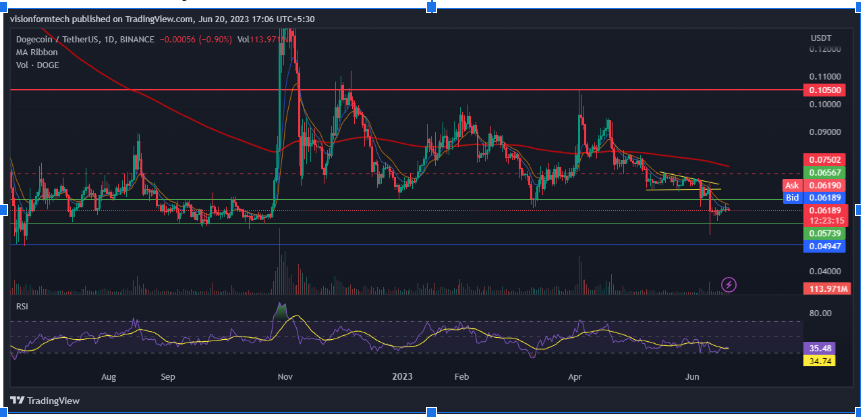
Source: DOGE/USDT by TradingView: https://www.tradingview.com/x/q1F5bT3n/
A thorough analysis of the daily chart gives key insights about the current state of the market. The price was trading between a range of 60% where the swing traders were playing along the support and resistance. The bulls tried to break the resistance of $0.1050 but the bears did not allow the price to go any further. As the market started to weaken, the bears began unleashing their strength. They began flooding the market with a huge number of tokens meanwhile, the lack of buyers fuelled the downfall of the price. The bears penetrated the key support of $0.0656 flushing down the price further. The bulls managed a swift recovery from the key support level but the overall trend remains bearish.
The 4H chart shows a minor consolidation
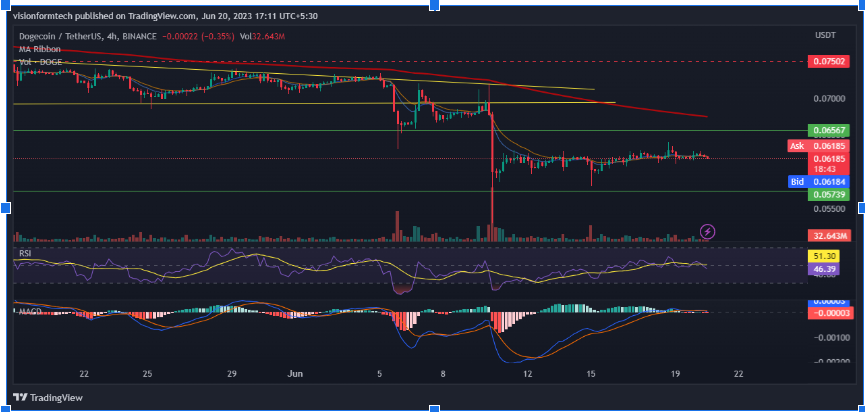
Source: DOGE/USDT by TradingView: https://www.tradingview.com/x/a0JdFwL7/
On a shorter time frame, The 4H chart is suggesting that the price may take a pause from its recent volatility while getting consolidated. The low volume conveys that the buyers are still afraid to enter at this point. This consolidation may lead to a further sell-off if bulls don’t show any strength.
In case of a breach of the support, the market must get ready for a further downside of 10% to its next support at $0.0500. The bulls can regain strength only if the price flips the 200 EMA. The journey to the upside is filled with many hurdles starting at the level of $0.0656 followed by the next resistance of $0.0750
RSI: The RSI indicator is currently at 48.32 and the RSI has crossed the MA line towards the downside This is a sign of bearish to sideways market condition.
MACD: The MACD indicator is about to make a bearish crossover and the MACD line is crawling just below the 0 line indicating bearish price action.
200 EMA: As observed, on the 4hr, the price is trading below the 200 EMA(exponential moving average) which acts as a significant resistance This is a clear indication of a downtrend where the sellers are in control and for a trend reversal, the price must break and trade above the 200 EMA.
Technical levels
Support Levels: $0.0573 – Support 1
$0.0500 – Support 2
Current Price: $0.0619
Resistance Levels: $0.0656 – Resistance 1
$0.0750 – Resistance 2
Conclusion:
Doge is currently testing key support levels which is a sign of weakness in the market. At present, the market is under sell pressure with the probability of further downfall. On the bright side, Doge is on sale with some big discounts and this will definitely attract a large number of investors. The asset can see some hope only if bulls manage to flip above 200 EMA overcoming the resistance levels. The present market conditions represent volatility and investors are advised to play with proper planning and risk management.