
- The NEXO coin can reach $1 in 2023.
- It is currently trading at $0.58 with a repulse of 0.8% in a day.
- The token is down by 87.39% from its All-Time High.
Nexo is a crypto loan platform that provides instant crypto loans. It gives users efficient and simple access to cash. The NEXO token is also used to derive benefits and discounts which makes it a fascinating investment for the users for portfolio diversification.
NEXO marked its all-time high on 16 Nov 2021, when it was priced at $4.63. The token is currently trading with a rise in daily volume of 11.5%.
- The circulating supply of the token is 560,000,011 NEXO, which is 56% of its total supply.
- The current trading volume of the token is $1.88 Million in a daily time frame.
- The market capitalization of the token is $326 Million.
The Nexo Token is a Bulgaria-based lending platform that has introduced a crypto-backed credit MasterCard for the citizens of the European Economic Area (EEA). When the users have a NEXO card, they can convert their cryptocurrency assets into U.S dollars, British Pounds, and Euros. The user-held assets on the card can earn up to 9% annual interest. Nexo is serving clients offering this to 30 different countries.
Nexo Sentiment Analysis
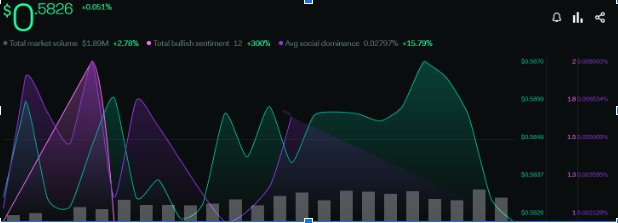
The token price increased by 0.051%. The total market volume has increased by 2.78% and the total bullish sentiment has increased by 300%. The average social dominance has surged by 15.79%. The daily sentiments of the token indicate a bullish price action.
Daily Technical Analysis
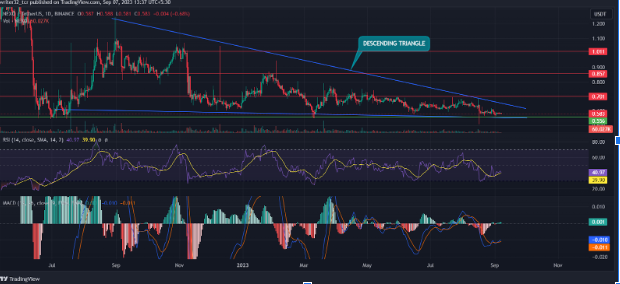
The candles make a descending triangle pattern in the daily time frame. The price is currently approaching the support zone. It has been in a sideways movement between $0.58 and $0.7.
The price is going to the bottom of the descending triangle to the support from where we can expect a bullish price action after the breakout of the pattern in an upward move in the upcoming days. To reach the $1 zone the price has to cross the resistance levels which are marked in the chart.
The $0.70 has been a major resistance for a long time. If we want to get to the $1 zone we have to break this major resistance level to get the bullish move. The bulls have to play a major role in this move as they have to keep the price moving upward with an immense volume.
The RSI is below the neutral level of 50. The RSI is moving at 40.97 points and the SMA 14 is at 39.90 points, which indicates the bearish trend of the price as it is under the oversold region.
The MACD is showing a bullish move as the fast blue line is above the red slow line. The histogram shows the increase in the inflow of the volume in the daily time frame, which shows that the buyers are entering the market.
Conclusion
The successful test from the support zone and the breakout above the descending triangle will confirm the bullish price action. Buyers can make entries at the support level of $0.55 and set their targets keeping the stop loss below the support zone.
In a bearish scenario, the breakout below the descending triangle will lead to the $0.54 range.
Technical Levels
- Support Levels: $0.55
- Resistance Levels: $0.7 AND $0.85
Disclaimer
The views and opinions stated by the author, or any people named in this article, are for informational purposes only and do not establish financial, investment, or other advice. Investing in or trading crypto assets comes with a risk of financial loss.