
IMX, the native token of Immutable, has been declining in value since March of this Year. This depreciation is due to the fact that the bulls were unable to sustain above the level of $1.268 which is a strong resistance on the daily time frame.
- IMX/USDT is down 0.97% since the start of the day
- IMX/USDT has lost 60% value from March of this year
IMX/USDT is trading at $0.611 which is the result of a fall from the swing high created in March. The price managed to pierce through the resistance of $1.268 for a very short time. However, the bulls couldn’t sustain above this level for long and the price started to tumble down quickly. Along the way down, the bears smashed multiple local support levels with a major daily level of $0.796. The asset has lost almost 60% of its value over the past 3 months.
Daily time frame show prices moving in a downward channel.
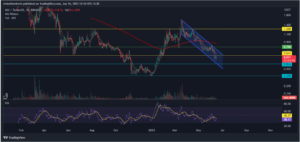
Source: IMX/USDT Binance price chart TradingView
According to the price action on the daily chart, the price is moving down in a parallel channel perfectly bouncing between the trendlines. This channel holds the key for reversal as a breakout above the resistance line could have a potential surge of almost 80-90% and can change the overall trend.
Currently, the trend is bearish which is identified by the market structure as the price creates lower highs and lower lows. At present, the price is trading below the daily support of $0.643 which is not a good sign. Though a bullish divergence can be observed on the RSI of the daily Chart indicating that the sellers might be getting exhausted.
4H chart displays a potential double bottom pattern
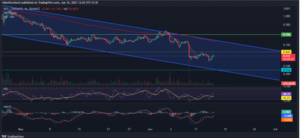
Source: IMX/USDT Binance price chart TradingView
The 4H time frame is a perfect representation of a downtrend as the price creates lower lows with a pullback. If we can observe, there is a formation of a potential double bottom. This can be confirmed only if the price manages to break above the neckline which is also the daily support that has turned into a resistance. In case of a breakout, a move of 12% can be expected targeted at the 200 EMA which is perfectly aligned with the upper trendline of the channel.
As the trend is bearish, it’s important to consider a potential fall of 15% towards the next support which is at $0.515.
RSI
The RSI indicator is currently at 47.82 and the RSI has crossed the MA line towards the upside. This can indicate a slightly bullish or sideways momentum
MACD
The MACD indicator made a bullish crossover suggesting the bears are taking a break. However, it is still below the 0 line and investors must remain cautious.
200 EMA
As it is observed, on the 4hr, the price is trading below the 200 EMA(exponential moving average) which acts as a significant resistance. This is a clear indication of a downtrend where the sellers are in control and for a trend reversal, the price must break and trade above the 200 EMA.
Technical levels
Support Levels: $0.2502 – Support 1
$0.1887 – Support 2
Current Price: $0.2578
Resistance Levels: $0.3244
Conclusion
IMX is finding it difficult to sustain its support levels and the bears are in control of the market. The formation of a downward channel on the daily time frame holds the key for reversal. Investors are closely watching this channel for a breakout as this event will increase the chances of a potential 80-90% upside. It’s important to consider that prices may see lower levels as the bear market continues.