- VUSA ETF stock has seen a bearish trend for over 2 months now generating almost 8% returns in 3 months.
- A bullish trendline is being respected and we might expect a breakdown for the same in the times ahead.
- The stock faced a rejection from a crucial resistance of 68.075 pounds recently
VUSA is an ETF under the vanguard group which is a global leader in asset management with about 7.7 trillion dollars worth assets under it. The group offers a wide range of investment products including multiple ETFs, mutual funds etc.

Technical analysis for the stock-
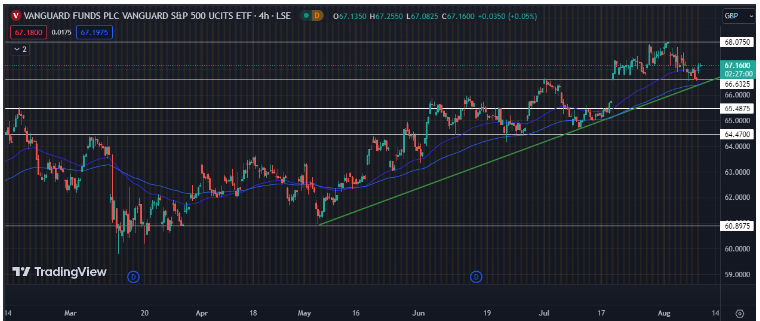
The stock broke a strong resistance of 64.47 pounds earlier in June this year and has seen a big upside from those levels. The stock hit a high of 68.075 and has seen strong consolidation since then.
The above chart clearly shows the stock going through all 3 phases with the accumulation starting in April this year and going ahead to the markup phase in June and July and the current formations show the stock entering A distribution zone after the stock hit a high.
The stock reverted from its support of 66.63 pounds and has seen a rise since then and is currently in the middle of a range. The stock has seen good upside this year and is in the profit booking stage right now. Therefore, expecting a huge movement anyside right now might not be the best idea.

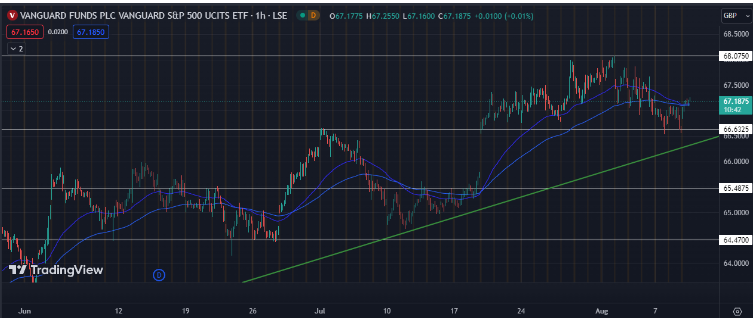
On a 1 hour chart, we see a sideways movement which is what generally happens in the distribution phase of a stock. The stock is very near to the trendline which it has been respecting since a long time now and we can expect a breakdown for the same as well.
Expectations are for the stock to trade between 66 to 68 pound levels for a few days atleast before making a big move and thus a close eye must be kept on the same.
Conclusion:
The stock has seen a fair upward movement recently and is current trading safely and with stability. If we see a breakdown for the current trendline, 65.985 will act as the first short target. On the upper side, 68.075 still remains as the target for buyers.
Major technical levels:
Major support zones- 66.632 followed by 65.995
Major resistance zones- 67.48 followed by 68.075
