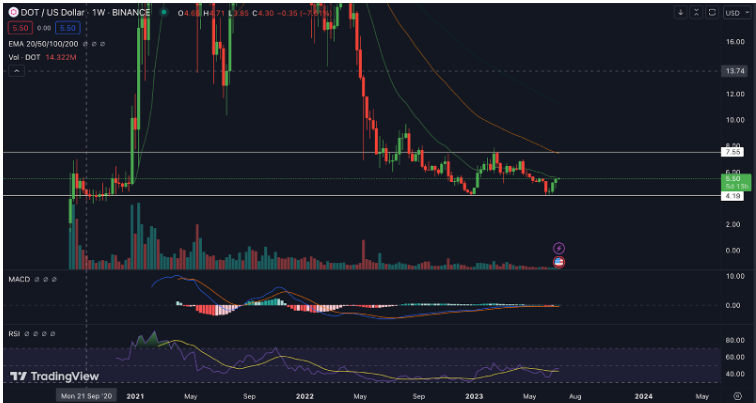
- Polkadot (DOT) is currently trading at $5.49.
- Polkadot (DOT)’s live market cap is $6,580,437,575.
- Polkadot (DOT)’s price is trading below the 20,50 and 100-day EMA.
Polkadot is a blockchain platform that enables the interoperability of several blockchains. Its goal is to build a decentralized network in which different blockchains may connect and share information. Polkadot, which was created by the Web3 Foundation, uses a unique multi-chain design called a “parachain” to enable scalability, security, and innovation in the blockchain field. It seeks to solve the limits of existing blockchain networks by enabling them to connect and interact, resulting in a more linked and efficient environment. Polkadot’s native coin is called DOT, and it is utilized for network governance and staking. Polkadot has gained attention in the blockchain sector for its emphasis on interoperability and scalability.
Trend Analysis
Polkadot (DOT) is now in a downturn and has a negative market structure, according to the study. DOT is now trading at $5.49, representing a 0.9% decline in today’s market session. DOT peaked in November 2021 at $55.95, but the price has been rapidly sliding since then, falling by almost 94% in a year. This large reduction in price shows that DOT is in a long-term downtrend. Although the price has attempted to break out of this pattern, it has been met with resistance and is still near its all-time low. According to this analysis, the decline momentum is expected to continue, and the price may consolidate within the same range for an extended period of time.
Polkadot (DOT) Price Prediction

EMA:
Polkadot (DOT) is now trading below the 20-day, 50-day and 100-day exponential moving averages on a weekly basis, signaling a bearish trend. This shows that DOT’s recent price movement has been primarily negative. Factors like bullish momentum and the mood of buy-side investors impact market sentiment for DOT.
MACD:
The MACD line for the Polkadot price projection in the daily period is now below the signal line, according to the most recent data. This bearish crossing suggests that in the short run, selling pressure may prevail over purchase demand. It indicates that Polkadot may be on the decline in the near future, and the general trend is unfavourable.
Conclusion
Lastly, the Polkadot (DOT) price forecast predicts a negative trend. This is further supported by the price’s bearish overall structure and movement below critical resistance levels. Also, indicators such as MACD and EMA are indicating a bearish attitude, adding to the unfavourable market sentiment around Polkadot.
Technical Levels:
Support – The current support position of Polkadot (DOT) is at $4.19.
Resistance -The current resistance position of the Polkadot (DOT) is $7.55.
Disclaimer
The thoughts and opinions expressed by the author or anyone else named in this article are solely for informational purposes. They don’t offer any advice of any kind, be it financial, investment, or otherwise. The possibility of losing money exists when buying, selling, or investing in cryptocurrencies.
