- PINS (Pinterest) is an American image-sharing and social media company.
- PINS was founded in December 2009 by Ben Sibermann, Paul Sciarra, and Evan Sharp. The company’s stock is listed on the New York Stock Exchange (NYSE).
- In this article, we will analyze the stock price of PINS.
PINS stock is up by 13.32% from the price at which it was listed. The all-time high of this stock was $65.95. After that, it never touched the same price again.
However, the stock has continuously fallen since Jan 2020 and it is in a sideways position.
The stock is trading at $27.65 and the chances of recovery are quite possible. It is moving in an upward direction from Jan 2022. We will analyze the stock through technical analysis.
Technical Analysis of PINS (Yearly)
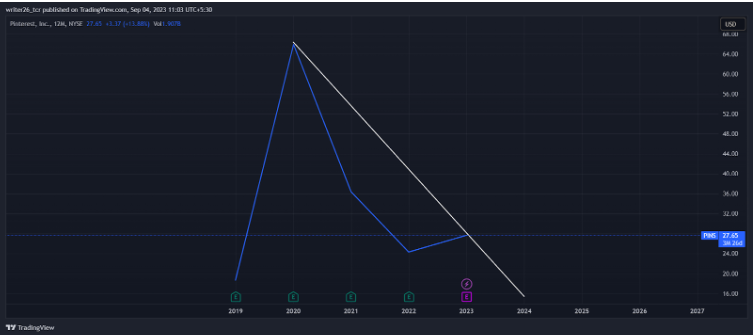
In the yearly time frame analysis, the stock is in a sideways position. After 2020, the stock is in a downtrend. It can make another resistance from the downtrend line to continue the downfall.
The stock is up by 25.11% from the previous year. It recovered by $3.50 in the last 20 months. However, this stock is not suitable for long-term investment, as it only recovered by $3.50 only.
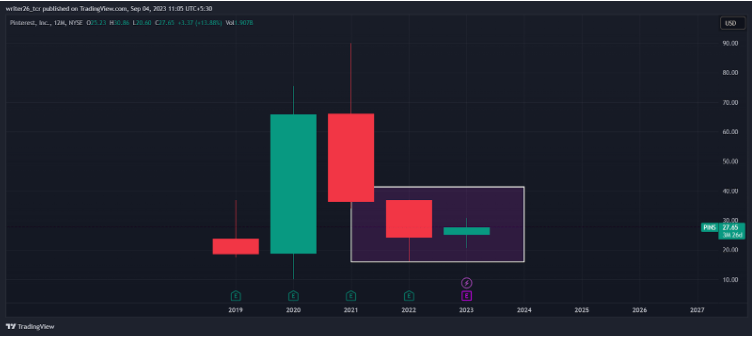
The pattern in the rectangle represents bullish harami, which means the stock can reverse its bear trend. It may continue the upward movement after this pattern in the future.
Technical Analysis of PINS (Monthly)
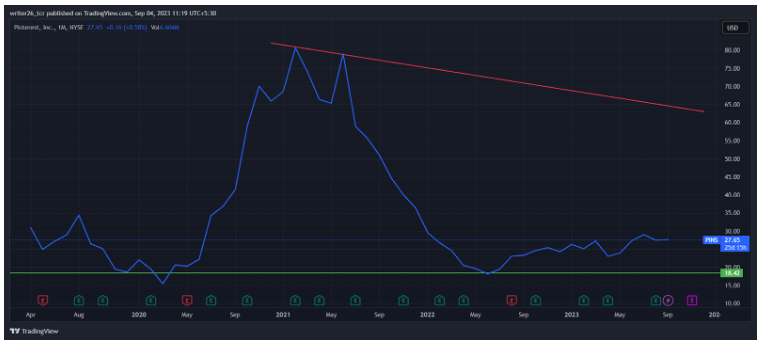
In the monthly time frame, the stock is in the range between the support level and resistance level. The stock is up by 3.71% from the last month. The PINS Share is not suitable for long-term and medium-term investments.
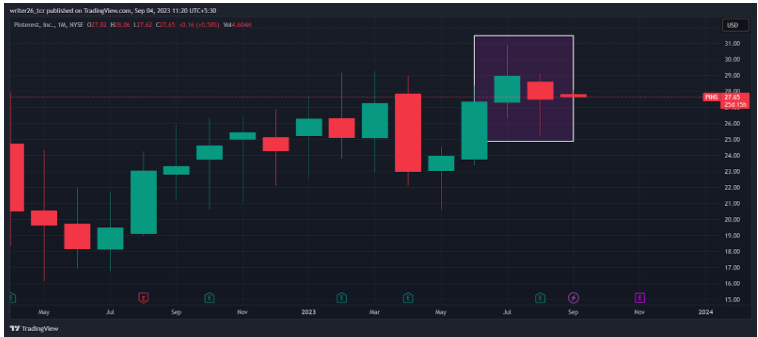
The pattern in the rectangle represents a bearish harami, which indicates a reversal in the uptrend. It means the stock can start retracement.
The next candle to it is a red candle. It clearly indicates that the price has started falling.
Technical Analysis of PINS (Weekly)
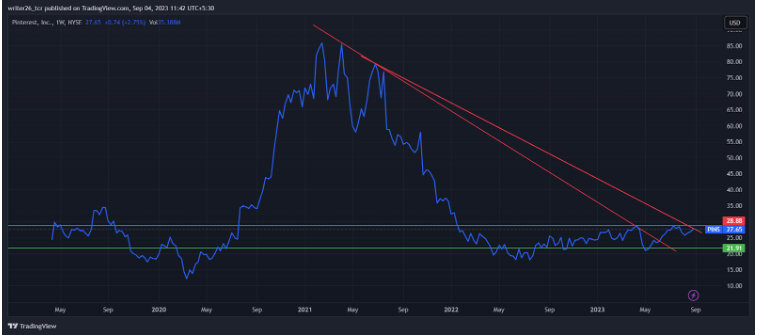
In the monthly time frame, the stock was in a sideways position. It is in a downtrend since 2021. The stock started some recovery, but now it has been trading in the range.
The stock price has been ranging between the support level and the resistance level. It is up by 1.76% from the past 5 days.
Technical Analysis of PINS(Daily)
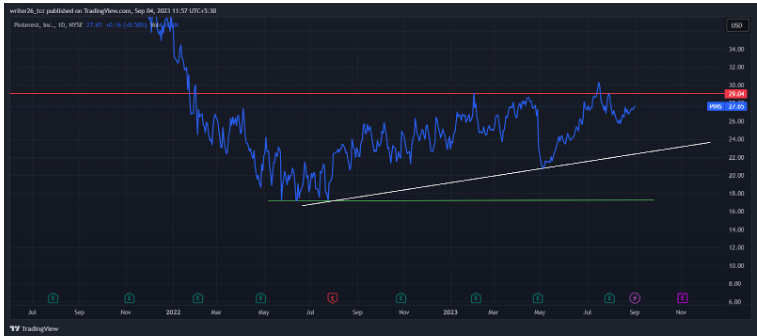
The stock is in uptrend but it is unable to break its resistance level. It took multiple support from the support line.
The stock took support from the trend line and showed upward movement. It again retraced from the resistance level.
The stock is in an uptrend again near the current market price. Let’s wait and watch if it is able to break the resistance level.
Conclusion
The stock was in a sideways position. So, it is not suitable for long-term investment. Intraday traders can invest their money in this share.
In the weekly time frame, the PINS share was in range. So, it can be used for sure returns.
Levels
Resistance Level- $28.13 and $26.77
Support Level- $20.55 and $17.18
Disclaimer
The analysis is done for providing information through technical analysis and no investment suggestions are given in the article to be made by investors.
