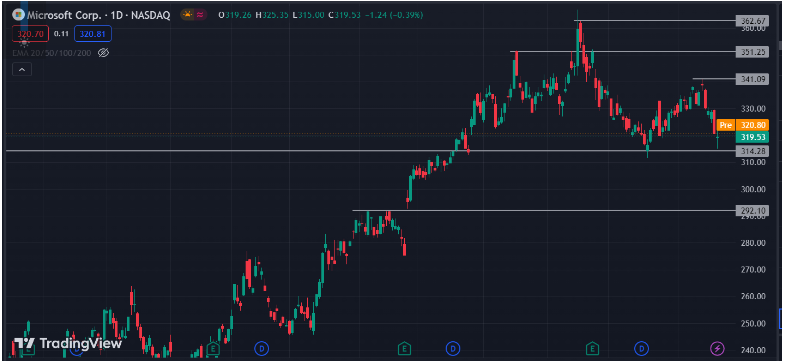
- The Microsoft Corp stock price is currently trading at $319.53 while having a decrease of -0.39% during intraday trading session.
- The stock price is trying to retest the $314.28 level 2 times since bullish correction.
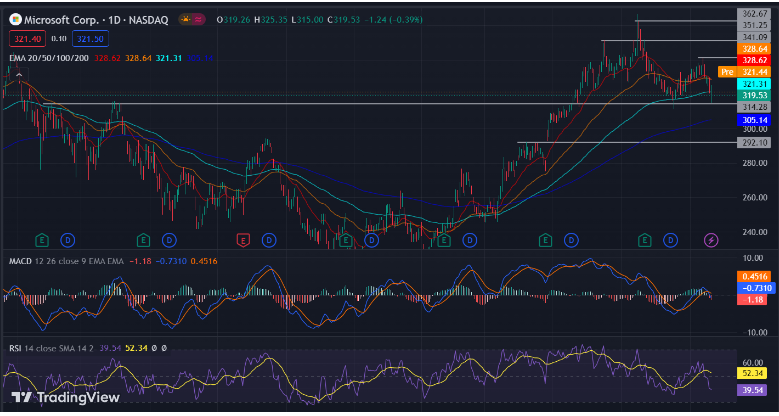
- MSFT stock price is performing in between 20, 50-day and 100, 200-day EMAs.
The Microsoft Corp stock price is currently trading at $319.53 with the pre-opening price of $321.12, The stock decreased almost -6.17% in the last 3 months trading session, while observing a drop of -0.39% during intraday trading session. But now the stock price is halting on the previous support level at $319.00.
The MSFT price is trying to retest the major support level at $314.28, but this level seems to have low possibility to sustain for another bullish strike, but the stock price is still trading above the 200-day EMA, and it hasn’t completely changed itself in downtrend yet at the same time price also respects the 100-day EMA at $321.31.

The stock price is trying to take the bullish correction, but it seems like that there is less strength at this particular level. After taking a rejection on this level the price formed, a Doji candle signifies that both buyers and sellers do not completely agree with each other. After all, it’s an uptrend on a longer timeframe that indicates the price will probably break the $362.67 resistance level in order to achieve the new all-time high value.
However, Now the stock price is trying to form a new swing low at $341.09, that can probably change the trend direction to downtrend for a short period of time if it successfully breaks down the support level at $314.28.
Will MSFT Price Break The $314.28 Support Level?
: 400;”>The answer is probably not, because the stock price has been trending upward direction Since January 6 2023, there is very less possibility that price will change its character to downtrend. By chance if the stock price breaks down the support level then it will drop to the $292.10 level.
The Stock price has more probability that it will do a correction between $309.48 and $314.28 levels, than it will surge toward the $362.67 major resistance level.
Is MSFT Price Making Bullish Correction?

After dropping from $366.78 all-time high, the stock price is slightly going in a bullish correction move at the level of $314.28, and price is getting between the 20, 50-day and 100, 200-day EMAs that indicates price is still trading in the uptrend. MACD is indicating similar volume between bears and bulls with signal and SMA line in the middle.
The RSI observing the signal strength at 52.34 and 39.54 is going toward the lower band indicating that the sellers have more strength compared to buyers at the current trading phase.
Technical Levels:
- Resistance Levels: $341.09 and $362.67
- Support Levels: $314.28 and $ $292.10
Disclaimer
The views and opinions stated by the author, or any people named in this article, is for informational purposes only. They do not establish financial, investment and any other advice. Investing in or trading in stocks comes with the risk of financial loss.
