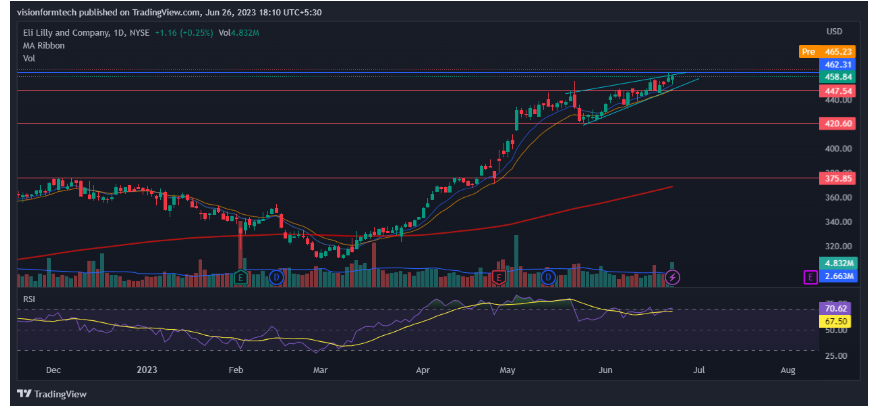
Eli Lilly & Co. closed the week at $458.84. Prices were up 0.25% in Friday’s Trading session. The Stock saw a weekly surge of 0.67% and an all-time high of $462.26.
- LLY Stock gained 25.77% in the last 6 months.
- LLY Stock returned 48.25% in the last one year.
Eli Lilly & Co. Chase & Co is in a strong Uptrend. The price started a strong rally just after a minor correction phase that ended in March. LLY is creating new higher highs as the stock performs extremely well amidst Global economic concerns. The market looks strong as the buyers keep buying even at higher prices.
The Stock is in a strong bullish rally.

Source: LLY by TradingView: https://www.tradingview.com/x/sJJZRg4m/
On the Daily Chart, Eli Lilly & Co appears to reach new heights as investments keep pouring into the market. The pharmaceutical company has performed better than other sectors while maintaining steady growth. The market seems to be forming an ascending triangle structure.
Such patterns have a bullish bias in a strong uptrend. A breakout can shoot the price to the $487 mark and can pave the way for $500. LLY stock is trading above the 9,15 and 200 EMA which justifies the strength of the market. The trading session on Friday closed with the formation of a hammer pattern which could signal further upside.
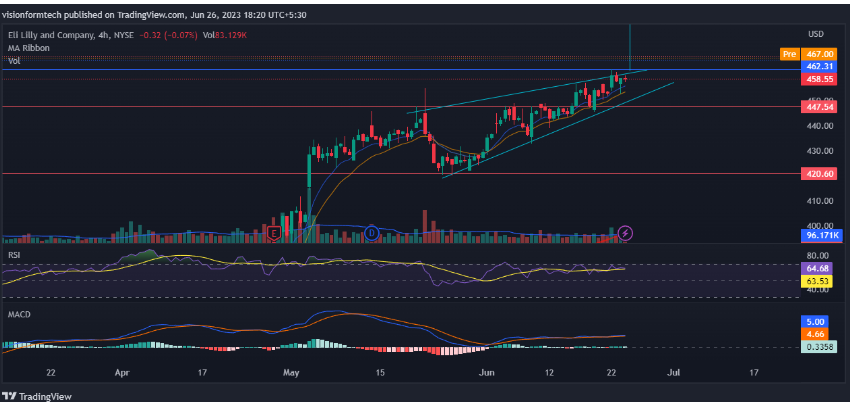
The 4H chart shows the formation of an ascending triangle.

Source: LLY by TradingView: https://www.tradingview.com/x/eJ3jaunL/
The 4H chart relays the bullish sentiments for LLY. The recent developments in the clinical trials for weight-loss treatment are adding to the bullishness of the market and establishing a promising future for the stock. As the prices rise, the market keeps on getting Greedy.
New Players must note that the market is overbought for some time and a correction can be expected. The Stock has a support of $447.54 which aligns with the trendline of the ascending channel. A breakdown of this triangle can result in a further correction of 6% to the support of $421.
RSI: The RSI indicator is currently at 64.68. It represents bullish to sideways conditions
MACD: The MACD indicator is moving close with the signal line while staying above 0. This indicates sideways or consolidated conditions.
200 EMA: As observed, on the 4hr, the price is trading above the 200 EMA(exponential moving average) which acts as a significant support. This is a clear indication of an uptrend where the buyers are in control and for a trend reversal, the price must break and trade below the 200 EMA.
Technical levels
Support Levels: $447.54- Support 1
$421.86- Support 2
Current Price: $458.84
Resistance Levels: $146.26
Conclusion:
Eli Lilly & Co. displayed excellent performance amidst global economic tensions. The stock continues its bullish rally while making new highs. The Bullish sentiments along with solid fundamentals give a scope of reaching $500 soon. Currently, the market is overbought but the Bulls are not shying away from the higher prices. The stock is proving to be a great hedge against the rising inflation. New Players can wait for the breakout of the triangle or a decent pullback. The stock remains bullish and there is no sign of a reversal or correction.
