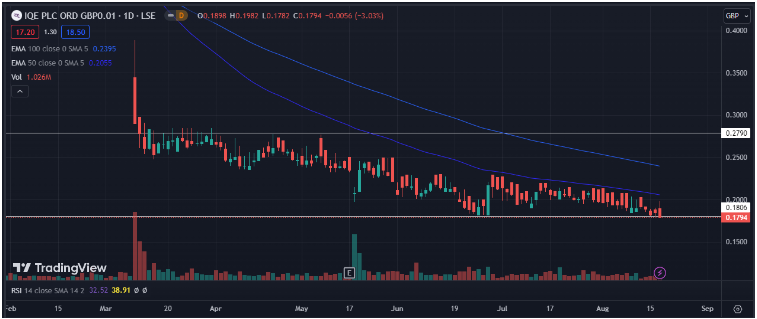
- IQE stock has been bearish almost the entire year giving a negative 60% return to its investors.
- The stock is at a crucial support level and is forming a bearish hammer pointing towards a further downside.
- Current setup looks weak for the stock as sellers are highly dominant currently.
IQE PLC is a British semiconductor company founded 1988 in Cardiff, Wales, which manufactures advanced epitaxial wafers for a wide range of technology applications for wireless, optoelectronic, electronic and solar devices. The company was started in 1999 and is currently run from Cardiff, Uk.
Financials look good for the company. The company has stayed cash flow positive consistently with slight ups and downs in revenue. Overall, company has a strong financial background.

Technical analysis for the stock:
On a daily chart, we can see a consistent bearish momentum in the stock from long back in March. The stock is currently trading in a zone between .179£ and .279£ and on its support forming a hammer.
Current setup looks highly weak for the stock. Buyers are nowhere to be seen and sellers are yet active in high quantities. Earnings report are supposed to be released in september for the company. If the reports come out good, we might see some positive movement in the stock.
The next support for the stock lies close by at .1662£ which will be the first possible target in case the stock is not able to hold the current support level.

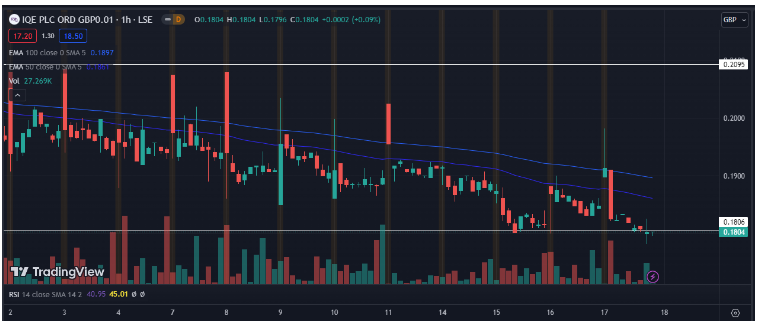
A one hour chart shows big red candles emerging in the past few days which is a clear indication of highly active sellers. The stock did for a pin bar as the last closed candle which is a positive sign. If the market supports, the stock should sustain over the current support at .1804£. If that happens, we can hope for more positive movement in the upcoming weeks.
If the stock does not sustain above the current support, .1662£ will be the next support followed by .1264£.
Indicators both on the daily and the hourly chart predict this bearish movement to continue. We should wait for the stock to give a positive opening for a few days before entering.
Analysts predict a 150% upside in the stock for next 1 year. One must wait for the stock to breach the next resistance at .2095£ before making an entry as the current momentum looks highly bearish.
Conclusion-
The company fundamentally looks good and has a huge upside potential according to analysts. Currently, the stock is caught in a bear trap and therefore no move should be made until the stock clearly breaks its current zone. We might see a positive price movement but one must wait for a few months before expecting the stock to move up.
Major technical levels-
Major support level- .180£ followed by .166£.
Major resistance levels- .209£ followed by .279£.
