- Alcon INC’s price has declined by 1.01% in a week and surged by 3.55% in a month and 20.06 % in a year.
- Alcon’s price is trading very close to its all-time high of $88.24.
- Alcon’s company has shown significant growth in revenue since 2016.
Market capital of Alcon – $ 40.94 billion
The current market price of Alcon – $ 81.93
Alcon is a pharmaceutical and medical device company specializing in eye care products. It is headquartered in Geneva. It was founded by Robert Alexander and William Conner.
Alcon INC ( ALC) stock Financial analysis
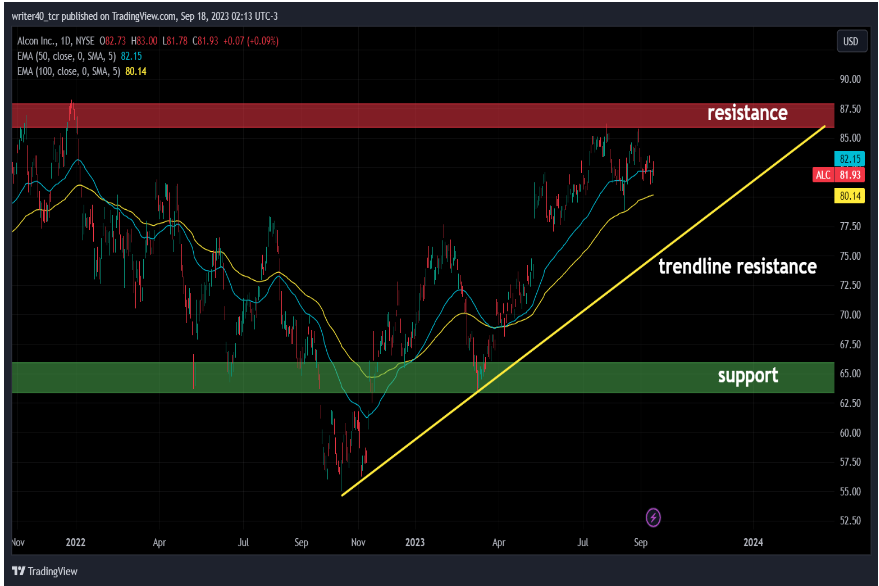
Alcon’s price in its last trading session on 15 September was closed in negative as the price has declined by $0.07 (0.09%). The price was open gap up at $82.73 and made a high of $83 but as the day proceeded the stock fell and closed at $81.93. The price has formed a bearish candle on the chart.
ALC has shown significant growth in its revenue as the revenue has risen from $6.39 billion in 2016 to $9.00 billion in 2022. The growth of 40% in six years is quite a good growth. The net income of the company has also risen from a loss of 164.78 million in 2016 to a profit of 345.99 million in 2022.
The net debt of the company is standing at $4.10 billion, it was standing at just $85 million in 2016 a rise of 4605% in six years. Cash and cash equivalent are standing at $2.7 billion which is less than the net debt. The company should take some corrective action to reduce its net debt for smooth growth.
Technical analysis of ALC on the daily chart

The price of ALC stock is trading very close to its resistance zone i.e. between $86-88. The price is currently in an uptrend and taking support of a rising trendline as drawn on the chart above in the yellow line. The price is also supported by the 50 and 100 EMA as the price is trading above both.
The EMA’s slope is upward which indicates that the price is super bullish and is supported by good fundamentals. The support is present near the $64-65 level which is marked in a green color on the chart. The price has formed an inverted head and shoulder pattern at the bottom and the neckline can act as a support.
The stock is forming a parallel range and it seems like it will consolidate more in this range in the near future as the price has tested the levels twice which confirms the range. The range can act as a support and resistance zone for the stock at least one time in future. The EMA is also near the support which can push the price up.
Technical Analysis on 1 Hour chart:

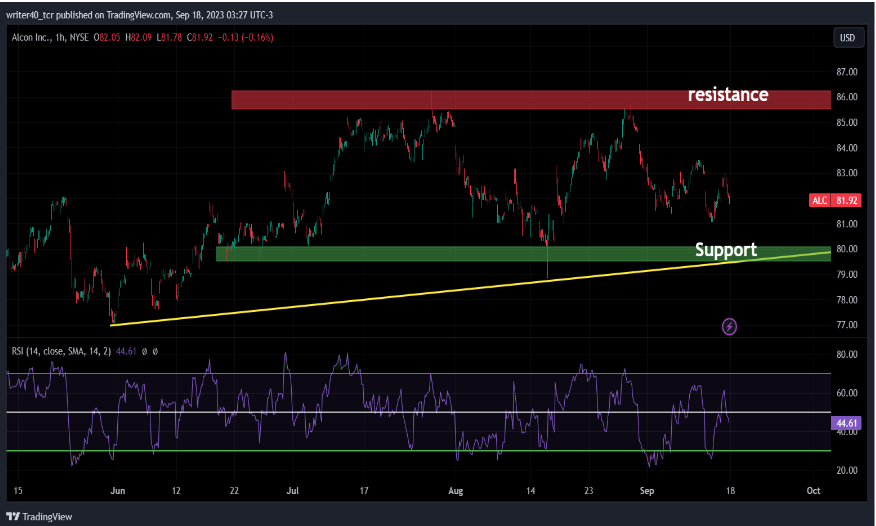
If we look closely at the 1-hour chart the price is currently heading towards the support zone where the rising trendline is placed along with the horizontal support. The price near those levels will attract more buyers to take some long positions for quick gains.
If we look at the RSI it is currently below 50 i.e. 44.64 which shows that the stock has lost momentum and is looking weak. The short-term trend of the stock on the 1-hour chart is also down which indicates that the stock can witness some more fall in the near future towards the level of $79.
Conclusion
As the price is currently trending down in a short-term time frame and on a daily time frame it is consolidating in a sideways range which indicates that the overall trend is sideways to negative now and the price can feel some pressure till $79 level, where the buyers can mark their presence and try to push the price up.
Technical Level
Resistance – $86- $88
Support – $80 – $63
Disclaimer
The analysis is done for providing information through technical analysis and no investment suggestions are given in the article to be made by investors. The coins are unpredictable so investors should have proper knowledge. Cryptocurrencies are highly volatile and risky. Investment should be made with proper technical analysis.
