- HLN is a British multinational healthcare and consumer goods company. The company is one of the largest consumer healthcare firms in the world.
- HLN was founded on 18th July 2022. The stock is listed on the London Stock Exchange(LSE).
- The current market price of the share is £3.26. We will analyse the price through some tools.
According to the forecast, the growth rate is expected to increase by 13.4% and the revenue is expected to increase by 3.7%.
Company’s cost management and execution is one of the reasons for the growth in the share price.
GSK, Pfizer and Novartis are the three consumer healthcare firms which combined together to form Haleon. HLN is an independent company.
Through technical analysis we will come to know about the variation in the stock price.
Technical Analysis of HLN(Yearly)
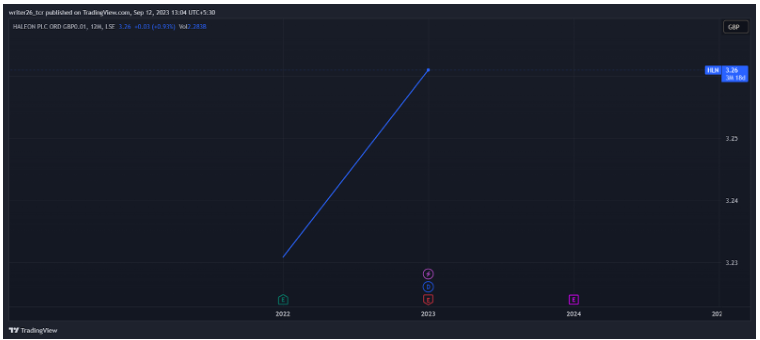
The line is similar to a 45 degree line which means the stock price is moving in an uptrend.
In the yearly time frame, stock from the beginning is having the potential to continue the price in the up direction in the future.
The stock is up by 3.48% overall and last year it was up by 24.05% which means it has given good returns to its investors.
Technical Analysis of HLN(Monthly)
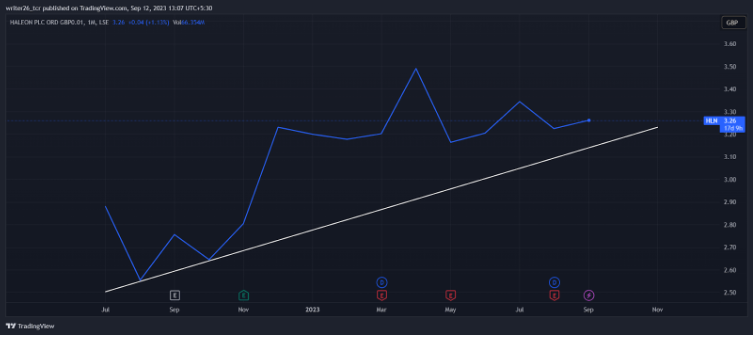
The stock in the yearly time frame was similar to a straight line but in the monthly time frame the chart is different.
It indicates that overall the stock is in uptrend.From March 2023, it is in a sideways position.
The stock was up by 5.70% in the last 6 months but last month it was down by (2.98%).
In the beginning, the stock price was falling but took support from the trend line and continued its upward movement.
Technical Analysis of HLN(Weekly)
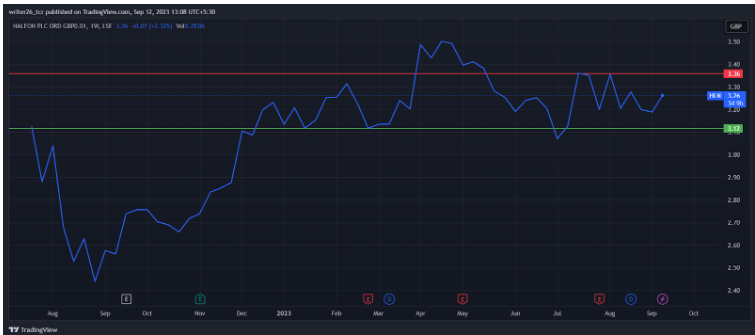
In the daily time frame, stock is in a sideways position. It was not able to break the resistance level. It was up by 4.73% in the last 5 days.
The stock tried to break the resistance level two times. The level became strong after making two new points.
It may again make a new resistance point and start to retrace from that point. Stock may be useds for long term investment by investors.
Technical Analysis of HLN(Daily)
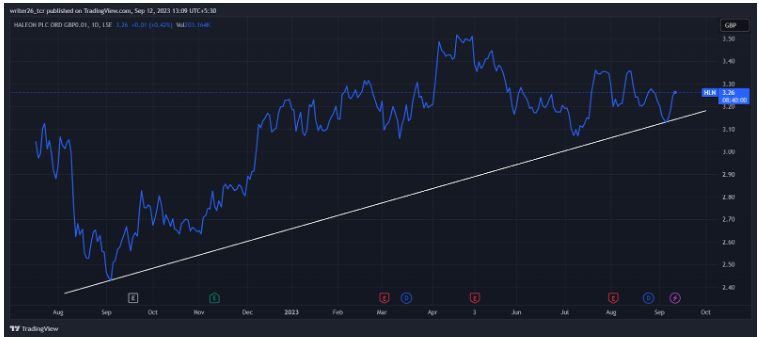
The stock overall is in an uptrend position. From December 2022, it is moving in a sideways position.
It might take support from the trend line and show some more higher moves in the future.
Overall, in daily, weekly, half yearly and annual time frames, stock is giving positive signs.
The stock has the capability to give good returns in the upcoming future for sure.
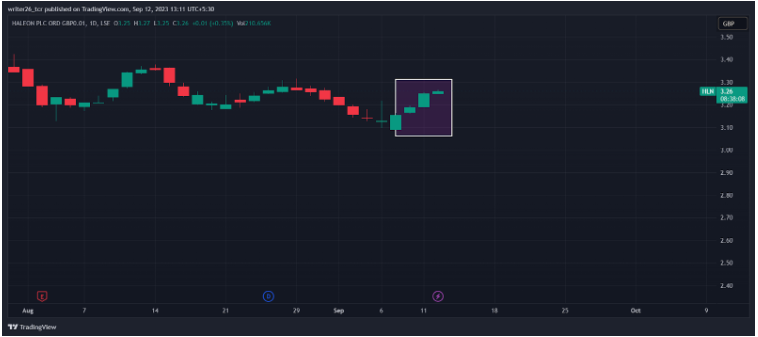
In candlestick pattern, it formed a three white soldier pattern which gives confirmation that it might continue its up movement.
Summary
Through the evaluation of stock with the help of technical analysis we can withdraw that overall the stock is in an uptrend position.
In the monthly time frame, it was in an upward direction which can help to earn good returns.
In the weekly time frame, it is moving in a sideways position.
In the daily time frame, it is in uptrend.In all time frames also it is moving up only except weekly time frame.
So the stock does have potential to generate a good amount of returns on the investment made by the general public in the yearly and monthly time frame.
Levels
Resistance Level- £3.35
Support Level- £3.07
Disclaimer
The analysis is done for providing information through technical analysis and no investment suggestions are given in the article to be made by investors.
The stocks need proper study. So investors should have proper knowledge.
Stocks are preferred more than the cryptocurrencies. The stocks are very safe for investment purposes.
This article is general in nature, no financial advice is given in the article.
