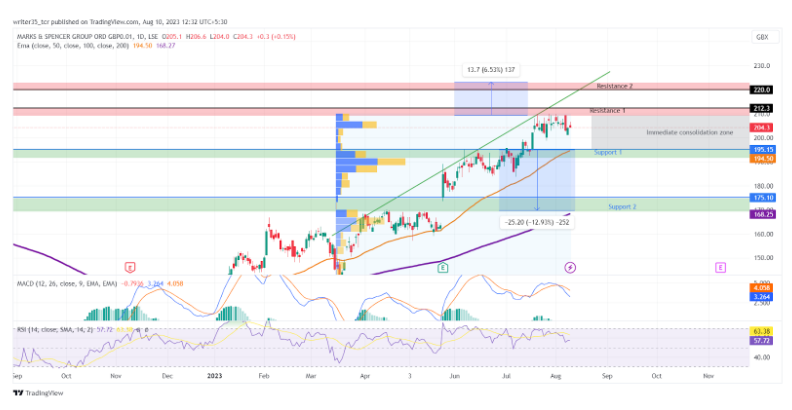
- M&S stock price prediction: The MKS share price has shown significant growth in the past as a result of a turnaround plan.
- A look at what caused the price to break all the resistance from the past 1 year.
- The price is in an uptrend but MACD gave a sell signal. What are the buying and selling levels?
Why is the MKS Share Price Rising?
The significant rise in the MKS share price was seen after the half yearly results were published. The surge in revenue by more than 10.5% and operating income by 21% has caused the bulls to return to their native state. Along with that, the clothing sales gave a growth of 11%, and the sales in the food section gave a growth of 9%. After all these results, the share price is seen to break all the resistances of the past year.
M&S Stock Previous Price Actions and Forecasting
MKS Previous Price Action
After December 2023, there was some rise in the price as the company announced a major turnaround plan which included simplifying the network, rearranging finance costs, and focusing on high growth categories in the market, The investors believe the company already started reflecting share prices as the stock,
In February, MKS’s share price broke a major resistance of $154. Following that, in March after some positive financials dropped, the bulls acted in their best potential, breaking all the resistances of the past 1 year.

MKS current Price Action
Currently, MKS share price has broken a major resistance and is trading near its 52-week high, between some supports and resistances, while the indicators are also giving some insights for the near future.
Support: Immediate support for the stock is seen at the level of $195, which is a broken resistance. The second support is again a broken resistance, at a price level of & 175.
Resistance: Since all the resistance levels of the past 1 year are broken, currently Resistance 1 is at the price value of $212. The MKS share price has tested it recently, and the long back days of February 2022. Meanwhile, the second resistance is at the level of $220.
Indicators
MACD: The MACD chart as a whole is well above the neutral territory, while the signal line for the time being has crossed the MACD line in August 2023, which has resulted in a soft consolidation for the time being.
RSI: The RSI after touching 70 points has come down to 57, and is currently trading a little above its neutral zone of 50.
EMAs: The price has taken support from its 50 EMA during the end days of May 2023 and surged up. Currently, the 50 EMA is below the current price as a result of a downtrend and is at the price level of $194.50.
Meanwhile, the 200 EMA is well below it and is seen rising with a slight uptrend at $168.25.
Is M&S Worth Buying Now?
Right now, the MKS share price has been in a very bullish momentum. The stock is trading just below its resistance zone 1. If the stock surpasses this resistance as per the trend line indicates, a deviation can occur. If it sustains after the resistance, then a buying can be made. However, it is likely to consolidate in the immediate consolidation zone because of the weakening of the recent EMAs in RSI and MACD.
Conclusion
After a positive earnings report, the MKS share price has shown a significant surge. Right now, the price is in an uptrend after taking support from 50 EMA while the MACD signal has resulted in some soft consolidation.
Technicals
Support: $195.15, $175.1
Resistance: $212.3, $220.0
RSI: 57
50 EMA: $194.5
200 EMA: $168.2
Disclaimer
The views and opinions stated by the author, or any people named in this article, are for informational purposes only. They do not establish financial, investment, or other advice. Investing in or trading crypto assets comes with a risk of financial loss.
