- COST Stock Price recorded a surge of 9.7% in the last one month
- COST Stock has a year-to-date performance of 16.33%
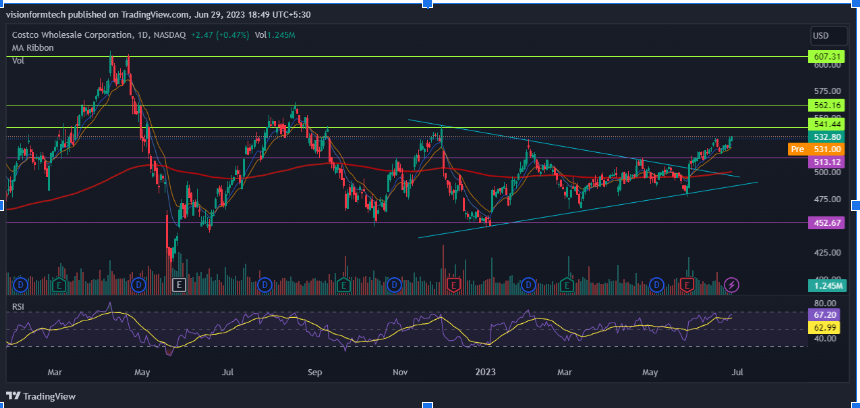
COST Stock Price has broken out of a symmetrical triangle and has managed to gain 5.22% so far. The stock is riding the wave of 9 and 15 EMA. Costco Wholesale Corporation, INC, Inc. closed the trading session on Wednesday at $532.80 with a surge of 0.47% over the previous day.
Costco is banning non-members from using the membership cards. Many Cardholders were sharing their Costco memberships and this didn’t feel right as the membership model is the most important aspect of the business.
COST Stock Price: Price broke out of a symmetrical triangle

Source: COST by TradingView:https://www.tradingview.com/x/J6U9DoTf/
According to the daily chart, COST stock price has been consolidating since May 2022. The accumulation phase began after the market fell from its all-time high of $612. The stock prices squeezed inside a symmetrical triangle pattern. Cost stock finally broke the pattern on the 26th May and the prices have been rising since.
COST Stock Price is heading towards a first major hurdle at $541. The Bulls will attempt to break it to continue the ascent towards the target of the triangle which is the all-time high of $612. The Price is above the daily 200 Ema which represents the strength of the Market.
Riding a wave of uptrend: Technical Indications!

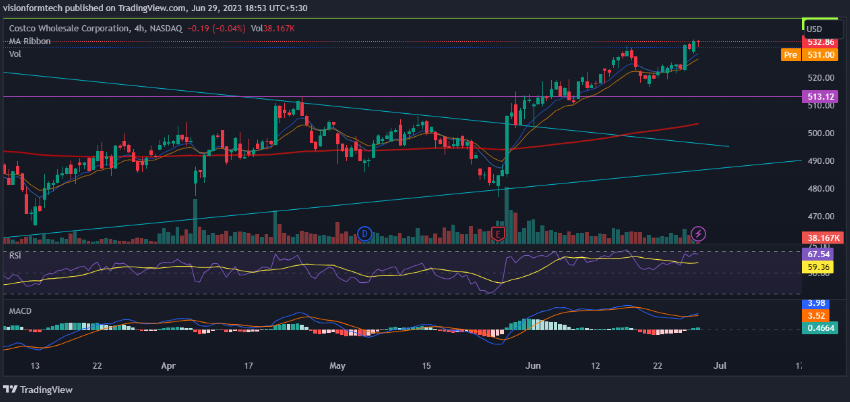
Source: COST by TradingView :https://www.tradingview.com/x/bhWRX6c2/
The 4H Chart gives a closer look at the bullish price action of COST Stock. The price maintains a steady trajectory with a support level at $513.12. The Short-term is bullish but the price may consolidate near the resistance.
The technical indicators are suggesting the slowing down of the momentum in the short-tem. The Volume is declining with the rise of price . The uptrend remains intact as long as the prices hold the 200 EMA . Price may move sideways if the candles slide below the 9 and 15 ema.
RSI: The RSI indicator is currently at 61.01. This highlights the strength of the market and the prices may continue to rise
MACD: The MACD indicator is Attempting a Bullish crossover above the 0 line. This signals at further bullish momentum.
200 EMA: As observed, on the 4hr, the price is trading above the 200 EMA(exponential moving average) which acts as a significant support. This is a clear indication of an uptrend where the buyers are in control and for a trend reversal, the price must break and trade below the 200 EMA.
Summary:
COST Stock Price has broken out of a symmetrical triangle and has managed to gain 5.22% so far. The overall trend remains bullish. The breakout of the triangle increases the probability of prices reaching all-time high levels. Technical Indicators convey a similar outlook. Investors are advised to consider researching the fundamentals to help with investment decisions.
Technical levels
Support Levels: $513.12- Support 1
$490- Support 2
Current Price: $541.44
Resistance Levels: $562.16
Disclaimer
In this article, the views and opinions stated by the author, or any people named are for informational purposes only, and they don’t establish investment, financial, or any other advice. Trading or investing in cryptocurrency assets comes with a risk of financial loss.
